Fall in sulfur dioxide emissions and deforestation are more responsible for recent warming than carbon dioxide emissions
By Climate Realists of B.C., July 1, 2025
Summary
Historically, climate changes and global warming have not been well understood because of the incredible complexity of our natural world.
Therefore, in 1988, the United Nations’ Intergovernmental Panel on Climate Change (IPCC) was established to assess the science related to climate change. The panel assumed that natural drivers are constant over time and that the recent observed increase in global temperatures is caused by increases of anthropogenic (human-generated) carbon dioxide in our atmosphere.
Physicists have always understood that global cloud cover controls the amount of energy from the sun that warms the surface of the earth. For example, the fewer clouds, the warmer the Earth’s surface. However, this was difficult to prove until after 1991, when cloud cover data from satellites became available. The data indicated a correlation with reduced cloud cover and increases in global warming.
Since 2010, the “Cloud Experiments” at the CERN laboratory in Switzerland have shown that cloud formation could be produced by cosmic rays interacting with atmospheric gases containing sulphur dioxide, along with many different types of hydrocarbon emissions from trees and plants.
Research since 2020 has shown that carbon dioxide has a minor effect in causing global temperature warming, and that changes in cloud cover have the most significant effect.
References are provided at the end of this report so that readers can find the scientific documents on-line with Google Scholar and website URLs.
History of CO2 and global warming
Charles Keeling, a Professor of Oceanography at the Scripps Institution of Oceanography, started collecting carbon dioxide samples from air in 1958. He produced data showing that atmospheric carbon dioxide levels were rising steadily, and the graphic plot later became known as the “Keeling Curve“. The data collection started by Keeling was continued at Mauna Loa, and is the longest continuous record of atmospheric carbon dioxide data ever collected.
During a speech at a Symposium on Atmospheric Pollution in 1969, Keeling observed:
“If the amount of CO2 were to rise by a factor of two, from 300 to 600 ppm, the increase in global temperature would be about 2.8°C. These calculations are not accurate predictions, however, because they are based on an assumption that other environmental factors do not change. The model is especially sensitive to changes in clouds. For example, a 30-parts-per-million (ppm) increase in CO2 (approximately what has occurred since 1850) would be compensated for by a 0.3% increase in low clouds or a 0.6% increase in middle clouds”[1].
So in 1969, we have a notable scientist declaring how uncertain the warming effects of CO2 are on the earth because of changes in cloud cover!
If you look at the Scripps Institute atmospheric CO2 data for 2024, you will see that the CO2 level in the Arctic is 430 ppm, and 418 ppm in the Antarctic.[2] However, there has been a 5°C increase in the Arctic temperatures during the last 40 years, and only a 2°C increase in the Antarctic.[3]
Since the difference in CO2 concentration between the Arctic and Antarctic is only 12 ppm, one would think that both the Arctic and Antarctic would have about the same increase in temperature. Why is this not true? Studies in 2021 from satellite data show that the annual cloud cover in the Arctic has decreased as much as 7% between 1982 and 2019,[4] and studies in Antarctica showed a 3% decrease in annual cloud cover.[5] This higher reduction in cloud cover in the Arctic accounts for the warmer temperatures and the increase in permafrost and ice melting in the Arctic.
In 2020, Dieter Schildknechk demonstrated that the green house warming effect from CO2 was a logarithmic function, and that increasing CO2 from 300 ppm to 600 ppm produced only a 0.5°C increase in global warming.[6] In addition, increasing CO2 from 600 ppm to 1200 ppm produced only a 0.5°C increase. This means that future increases in CO2 will have insignificant effects on global temperatures. This work was also supported by laboratory experiments that verified these results.[7]
In 2024, three notable scientists published the report “Net Zero Averted Temperature Increase,” which calculated that if the world achieved a net zero level in CO2 emissions by 2050, the net increase of average global temperature would be 0.07°C.[8]
The conclusion is that CO2 gas in the atmosphere has a very small warming effect as it approaches saturation of absorption of infrared radiation as the CO2 concentration increases above 300 ppm. This means that increases in CO2 concentration above 300 ppm cannot explain the rise in global temperatures that have been observed in the last 60 years.
Observed reductions in annual global cloud cover
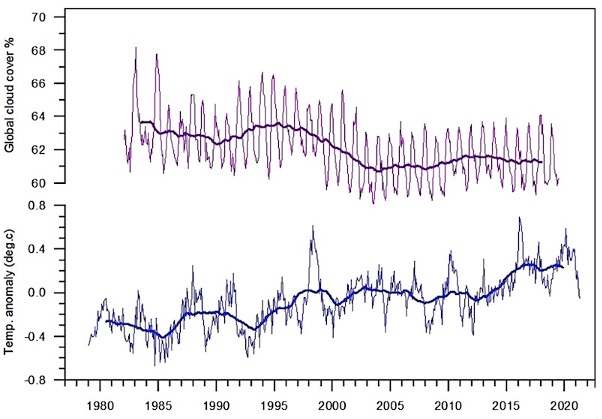
In 2024, a research paper was published showing a correlation between global cloud cover based on satellite data and the global temperature anomaly.[9]
The graphs in Figure 1 indicate a correlation between cloud cover and temperature.[10] Note that between 1984 and 2018, a 3 percent decrease in cloud cover resulted in a 0.6°C increase in global warming.
What causes cloud cover to change?
Changes in cloud cover can be caused by many natural variables such as volcanoes, sunspot cycles, changes in ocean currents, atmospheric storms, changes in forest cover, etc.
The scientific investigation of global cloud cover changes began with the Danish physicist, Henrik Svensmark, who was studying sun spot cycles and their relationship to cloud cover in 1997. [11] He discovered that the increasing cosmic ray flux from the sun during the peaks of the 11-year sunspot cycles correlated well with the increased cloud cover on the earth. The graph in Figure 2 shows the correlation between cosmic ray flux and cloud cover during the 1980 to 1991 sunspot cycle.
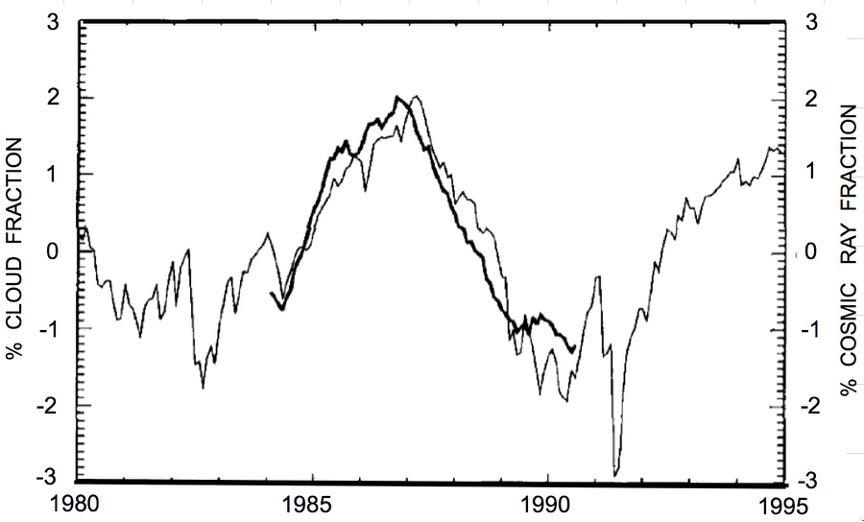
When Svensmark’s research was reviewed by other scientists, many questioned if these changes in cloud cover could explain “global warming” since the sunspot cycles were occurring in regular 11 year cycles, and should average out and become insignificant over time. However, Svensmark’s research was just the beginning of understanding how important atmospheric chemistry and cosmic rays are in controlling the earth’s surface temperature.
Since 1991, both NASA and Russia launched satellites that use visible and ultraviolet light spectroscopy to identify the various chemicals and their concentrations in the atmosphere. The data from these satellites provides important information on atmospheric chemical compounds and their concentration as well as the wavelength and energy of the sunlight in the atmosphere.
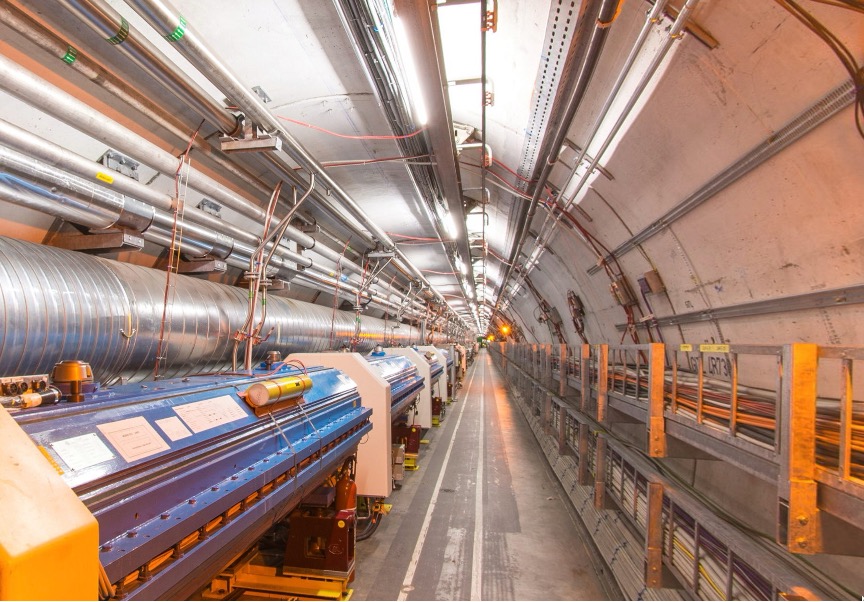
In 2006, scientists at the CERN high-energy particle-physics laboratory in Switzerland (see Figure 3) began atmospheric-physics experiments to test Svensmark’s thesis. This was called the “Cloud Experiment.” Svensmark worked with a group of 46 international scientists for four years to complete the first “Cloud Experiment,” which simulated the atmospheric chemistry and interaction with cosmic rays.[12]
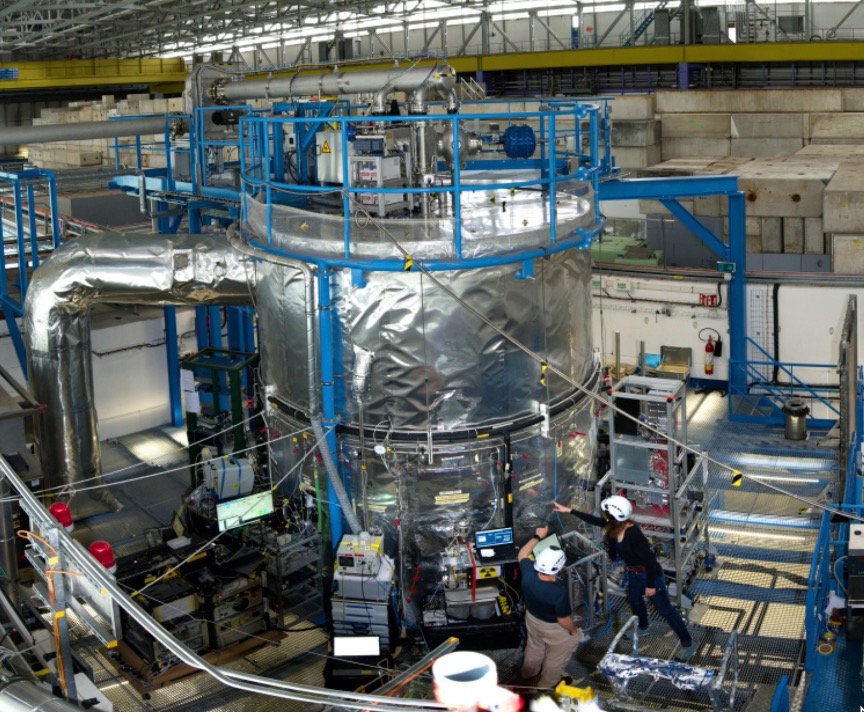
The “Cloud Experiment” took place in the chamber shown in Figure 4 that contained a mixture of gases at realistic concentrations to simulate the chemistry of the lower atmosphere. Ultraviolet light was used to simulate the sunlight, and high-energy particles from the Large Hadron Collider were used to simulate cosmic rays. This experiment showed that cosmic rays act as catalysts to cloud formation by forming clusters of sulfuric-acid droplets from sulfur-dioxide gas and water molecules.
Also note that during the 20th century, the sun’s magnetic fields have increased and reduced the average cosmic ray flux resulting in fewer clouds and increased energy from the sun coming to the earth.[13] This was a significant discovery that helps explain part of the “global warming” observed since 1900.
Since the first “Cloud Experiment” was completed in 2010, there has been more experiments at the CERN laboratory using complex mixtures of atmospheric chemicals to better understand how cosmic rays increase cloud formation.
Here is a summary of what has been learned from the CERN Cloud Experiments since 2013:
- a. In addition to sulfuric acid, water molecules, and ammonia, it was discovered that hydrocarbons from living organisms (trees) also contribute to cloud formation.[14]
- b. Sesquiterpenes are a type of hydrocarbon produced by plants and marine organisms. When compared with a mixture of other atmospheric hydrocarbons, the addition only two percent sesquiterpenes doubles the cloud formation rate. Conifer forests emit large amounts of sesquiterpenes.[15] [16]
- c. In the upper troposphere, isoprene hydrocarbons from trees and iodine from the ocean interact with both lightning and cosmic rays to generate low-level clouds.[17]
Reduction of sulfur dioxide and sesquiterpenes in the atmosphere.
Since the CERN Cloud experiments proved that cosmic rays interact with sulfur dioxide to form clouds that cool the earth, we can now examine the long-term effects of burning fossil fuels on global temperature. Figure 5 shows that world fossil-fuel consumption has increased very rapidly since 1900 and is at a peak today.
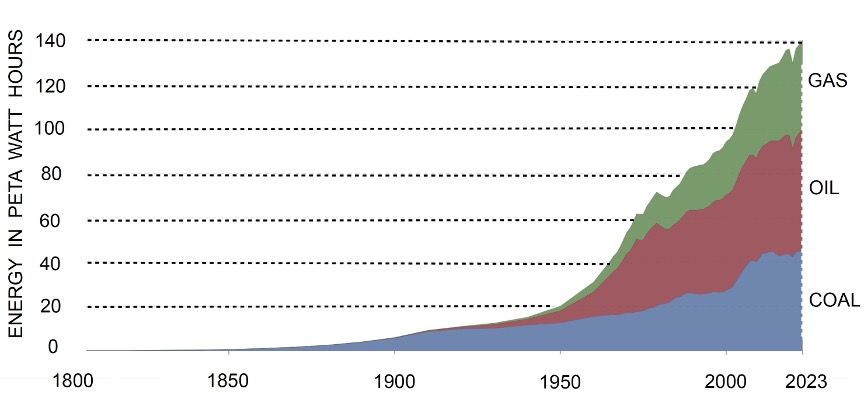
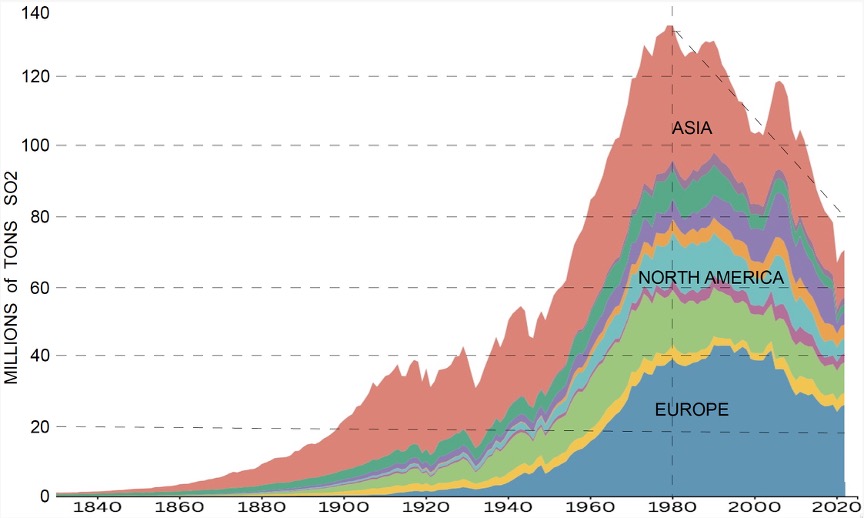
Figure 6 shows the annual rise in sulfur dioxide released to the atmosphere from burning fossil fuels. Note that the amount of SO2 released now is about 60 per cent of what was released during the peak in 1980. This is because people around the world began to put emission controls on coal-burning plants, cleaned natural gas before burning, and used refined oil (which is cleaner-burning than unrefined oils) in furnaces, ships, cars, factories, etc.
Let’s go back to the graph in Figure 1 that shows global temperature and cloud cover anomalies. Note that between 1980 and 2020, the global temperature has increased by 0.6°C, while cloud cover has decreased by three per cent. Could this rapid rate of temperature increase be caused by the decrease of SO2emissions?
According to the World Resources Institute, the earth’s forest cover has reduced from 48% in 1900 to 38% in 2018.[18] About 80% of the forest cover loss was from the expansion of agriculture. This means we have lost about 20% of global forest cover since 1900. Have we unknowingly compensated for the loss of sesquiterpenes produced from the forests by increasing SO2 emissions from fossil fuels?
Note that some scientists[19] are very concerned about the recent international regulations that require ships to add SO2 scrubbers to the engine exhausts.[20] These regulations will reduce SO2 emissions and will cause further decreases in global cloud cover.
Problems with IPCC climate science.
Note that in 2023, the IPCC stated that “the radiative feedbacks of clouds were identified as a major source of uncertainty for modeling future climate change”,[21] but it would not acknowledge the effect of cosmic rays on cloud formation in the atmosphere that was observed during the CERN “Cloud Experiments.” The IPCC also did not mention the decline in annual global cloud cover during the last 40 years that was observed from satellite data.
Unfortunately, there is a major disconnect between the IPCC scientists who assume that anthropogeniccarbon dioxide is the main driver of the observed increasing global temperature, and the many other scientists around the world who are challenging the “CO2 consensus” and are making new discoveries.
How can we manage climate change in the future?
Natural science is complex and our knowledge of changing cloud cover and the effect of cosmic rays is at an early stage of development. Here are some possibilities that will require more scientific research to come up with practical solutions to control global warming:
- a. Continue to burn fossil fuels to provide sulfur dioxide (SO2) to the atmosphere, and remove SO2 scrubber systems from some existing emission controls. This will increase cloud cover and decrease warming.The removal of SO2 scrubbers from coal and oil burning facilities, and metal smelters would have to be carefully selected to prevent any negative health effects on the local populations.
- b. Plant large numbers of the tree varieties that produce the highest levels of sesquiterpenes that trigger cloud formation. This will also require more research to select the best tree varieties that would grow well in different climates.
- c. Develop genetically engineered trees and agricultural plants to produce the specific isoprenes, monoterpenes, and sesquiterpenes that trigger cloud formation. This could be the best long-term solution to stabilize the annual cloud cover on the earth.
Conclusion
It appears that humans have had a role in causing global warming! But not in the way the IPCC believes.
During the last 100 years, the Earth’s population has grown from 2 billion to 8.2 billion and people have had to rely on removing forests to expand agriculture production for survival, as well as a source of building materials and, in some parts of the world still, for warmth.
But this reduction in trees has had a side-effect: a reduction in the amount of hydrocarbons (e.g., sesquiterpenes) released to the atmosphere. These hydrocarbons encourage cloud formation, which in turn cools the Earth; fewer trees, and therefore less hydrocarbon release, have meant reduced cloud cover, leading to increased “global warming.” As a cause (the “thermostat”) of global warming, carbon dioxide generated by burning fossil-fuels is a minor player compared to this fall in cloud cover.
On the plus side, by increasing the CO2 levels in the atmosphere, the burning of fossil fuels has had the beneficial effect of boosting agriculture production[22] , and increased the greening of the Earth [23] [24] .
Overall, increasing the Earth’s forest cover—with the help of more CO2!—would have a far greater effect in reducing “global warming” than the Net Zero by 2050 policy of strangling fossil-fuel use, which will only severely damage the world’s economies and cause hardship for billions of people.
The author is a retired electrical engineer who worked at the Superconducting Super Collider Project.
References
[1] Charles D. Keeling, “Is Carbon Dioxide from Fossil Fuel Changing Man’s Environment?” Symposium on Atmospheric Pollution: Its Long-term Implications, April 25, 1969.
[2] Scripps Institute CO2 Program, https://scrippsCO2.ucsd.edu/data/atmospheric_CO2/
[3] Global Temperature Report for 2024, BerkeleyEarth.org.
[4] Xi Wang, et al, “Seasonal Trends in Clouds and Radiation over the Arctic Seas from Satellite Observations During 1982 to 2019.” Remote Sensing MDPI, https://doi.org/10.3390/rs13163201, 2021.
[5] David H. Bromwich et al, “Tropospheric Clouds in Antarctica.” AGU Reviews of Geophysics. Vol 50, RG1004, doi:10.1029/2011RG000363. 2012.
[6] Dieter Schildknecht, “Saturation of the Infrared Absorption by CO2 on the Atmosphere.” International Journal of Modern Physics, 2020.
[7] Jan Kubicki et al, “Saturation of the Absorption of the Thermal Radiation by Atmospheric Carbon Dioxide.” Applications in Engineering Science, 2020.
[8] Richard Lindzen et al, “Net Zero Averted Temperature Increase.” Available at https://wvanwijngaarden.info.yorku.ca/files/2024/06/Arxiv-Netzero.pdf?x45936, 2024. The warming would be 0.28°C, still a low number, if fourfold (theoretical) feedbacks were added.
[9] John McLean, “Late Twentieth-Century Warming and Variations in Cloud Cover.” Atmospheric and Climate Sciences, 2014.
[10] Michael Nelson et al, “Decoupling CO2 from Climate Change.” International Journal of Geosciences, 2024, 15, 246-269. Available at https://www.scirp.org/journal/ijg.
[11] H. Svensmark and E. Friis-Christensen, “Variation of cosmic ray flux and global cloud coverage – a missing link in solar-climate relationships.” Journal of Atmospheric and Solar-Terrestrial Physics, 1997.
[12] J. Duplissy et al. (46 international scientists), “Results from the CERN Pilot CLOUD Experiment.” Atmospheric Chemistry and Physics, 2010.
[13] M. Lockwood, “Long-term Variations in the Magnetic Fields of the Sun and the Heliosphere: Their Origin, Effects, and Implications.” Journal of Geophysical Research, 2001. Stronger solar radiation acts as a shield against cosmic rays.
[14] Eimear M. Dunne, et al, and 58 international scientists, “Global atmospheric particle formation from CERN CLOUD measurements.” Science AAAS, Vol 344, Issue 6316, 2016.
[15] Lubna Dada et al (54 international scientists), Role of Sesquiterpenes in Biogenic New Particle Formation, American Association for the Advancement of Science. Experiments done at CERN 2023.
[16] Jan Berndorff, “How Trees Influence Cloud Formation.” Paul Scherrer Institute. October 2023. Available at https://phys.org/news/2023-09-trees-cloud-formation.html.
[17] Jiali Shen et al. (79 international scientists), “New Particle Formation from Isoprene Under Upper-Tropospheric Conditions at CERN.” Nature, 2024.
[18] World Resources Institute, Global Forest Review, https://gfr.wri.org/forest-extent-indicators/forest-loss.
[19] Tianle Yuan, et al., “Abrupt Reduction in Shipping Emission as an Inadvertent Geoengineering Termination Shock Produces Substantial Radiative Warming.” Communications Earth & Environment, https://doi.org/10.1038/s43247-024-01442-3.
[20] International Maritime Organization, IMO SO2 regulation 2020. https://www.imo.org/en/MediaCentre/HotTopics/Pages/Sulfur-2020.aspx.
[21] IPCC Climate Change 2023 Synthesis Report. https://www.ipcc.ch/report/ar6/syr/downloads/report/IPCC_AR6_SYR_SPM.pdf.
[22] Zaichun Zhu et al 31 international scientists, “Greening of the Earth and its Drivers.” Nature Climate Change 6, 791–795, 2016. Available at: https://doi.org/10.1038/nclimate3004.
[23] Martin Brandt et al, “Satellite-Observed Major Greening and Biomass Increase in South China Karst During Recent Decade.” Earth’s Future, 2018. Available at https:doi.org/10.1029/2018EF000890, 2018.
[24] Plants capture CO2 molecules from the atmosphere for photosynthesis and growth through tiny holes in their leaves (stomata). When CO2 levels are low, the stomata must stay open longer, which means the plant loses water. When CO2 levels are high, the stomata don’t need to stay open as long, thereby conserving water, which makes the plant more drought-resistant while also promoting faster growth. This increase in growth (by up to 30 per cent and more) is why greenhouse farmers add 1,000 ppm or more of CO2 to their greenhouses.